Try any paid plan free for 14 days — no credit card, no commitment, no contract.14-day free trial on all paid plans — no card needed. Start free trial
Google Review Analytics & Reporting
Turn your Google reviews into actionable data. Trend charts, year-over-year comparison, filters, and exportable reports.
Who this is for
Business owners
Want data-driven decisions about your reputation. See which months were strong, which need attention.
Marketing teams
Report review performance to stakeholders with formatted PDFs, trend charts, and year-over-year data.
Agencies needing deliverables
Export client-ready reports that prove your value. CSV for raw data, PDF for presentations.
The problem
Google shows your current rating but not how it changed. No trend charts, no year-over-year comparison, no way to filter reviews by keyword or date range, and no export option.
When stakeholders ask "how are our reviews doing?" you're left screenshotting Google or manually counting stars. There's no way to demonstrate progress over time.
How it works
- 1
Reviews imported and indexed
All your Google reviews are synced, stored, and indexed for fast filtering and analysis.
- 2
Dashboard shows trends and comparisons
Trend charts, YoY comparison, and rating distribution — all updating automatically with each sync.
- 3
Filter by star rating, date range, keyword, location
Slice your data any way you need. Find all 1-star reviews from last quarter, or all reviews mentioning "wait time".
- 4
Export as CSV or formatted PDF reports
CSV for raw data analysis. PDF for client-ready deliverables with charts and summaries. Branding varies by report type.
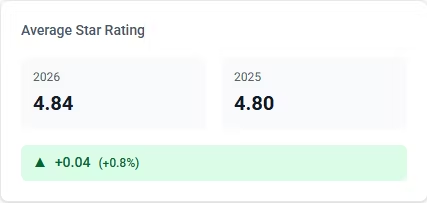
Demo data shown.
Feature availability by plan
| Plan | Analytics | Filters | CSV/PDF Export |
|---|---|---|---|
| Starter (free) | Basic + 90-day trend for one selected location | ✓ | Basic CSV + 1 branded summary PDF opening/month |
| Personal | ✓ | ✓ | Basic CSV + 1 branded summary PDF opening/month |
| Professional | ✓ | ✓ | ✓ |
| Enterprise | ✓ | ✓ | Advanced CSV/PDF reports |
Review Images for Social Media
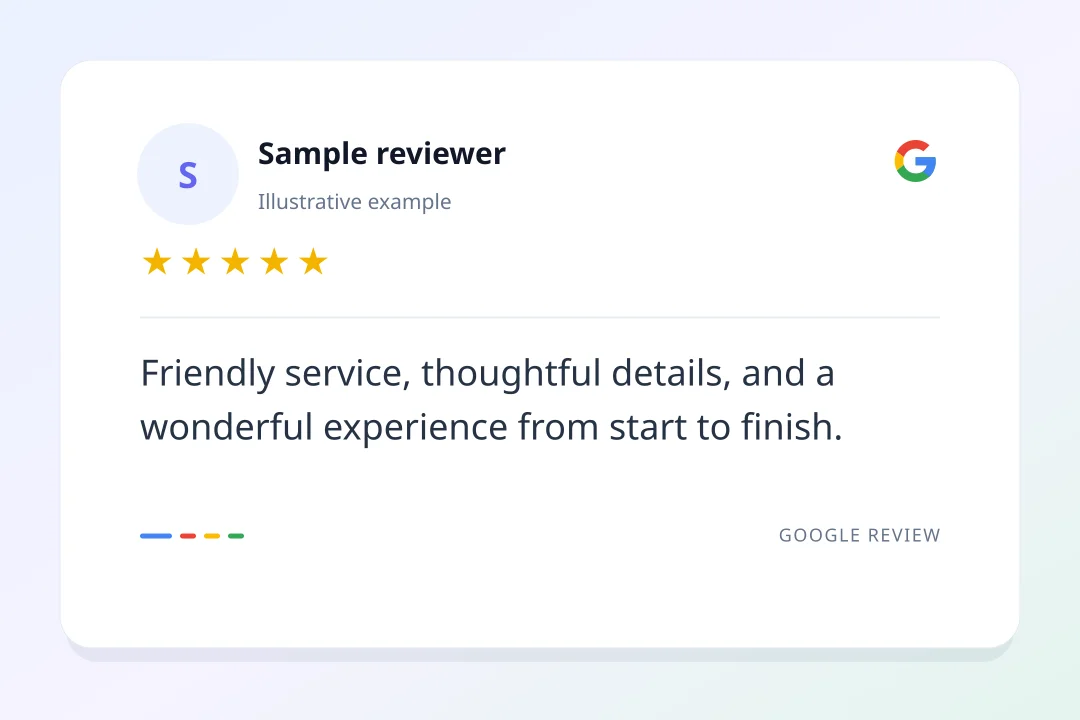
Turn Google reviews with text into polished marketing images. Starter includes 3 JPG, WebP, or AVIF downloads per month with ReviewPanel attribution. Personal and higher remove attribution and add SVG downloads.
- Create an image from any review with text in your dashboard.
- Keep the full review: long text expands the image vertically.
- Choose a soft outer background or crop to the review card.
- Starter: 3 attributed downloads/month in JPG, WebP, or AVIF. Paid plans add SVG and remove attribution.
Limitations
- Analytics reflect synced data only. If a review hasn't been imported yet, it won't appear in reports.
- Reports are generated on-demand. There is no scheduled automation for report delivery at this time.
- Agency workspace review analytics reports support your brand; other report types may retain ReviewPanel branding. Agency workspace geo-grid PDF reports can include your company name and logo.
FAQ
What metrics are tracked?
Rating over time, review count growth, rating distribution (1–5 stars), year-over-year comparison, and review velocity. All filterable by location, date range, and star rating.
What's the difference between weighted and average rating?
Average rating is the simple mean of all stars. Weighted rating factors in recency — newer reviews count more. Both are shown on your dashboard.
What export formats are available?
Basic CSV exports are included on every plan. Starter and Personal include one ReviewPanel-branded review summary PDF opening per calendar month. Professional and higher add advanced CSV and PDF reports. Opening the summary print dialog uses the monthly allowance, even if you cancel; choose Save as PDF to download it.
Can I add my logo to PDF reports?
Agency workspace geo-grid PDF reports can include your company name and logo. Agency workspace review analytics reports also support branding. Other report types may retain ReviewPanel branding.
Turn your reviews into insights
Start free with a 90-day trend for one selected location, basic CSV exports, and one branded summary PDF opening per month. Personal adds detailed trends and response analytics; Professional adds advanced exports.